Part 3 – Analysing Data, Preparation, Dimension Reduction and Visual Exploration

In the last part a data frame was created.

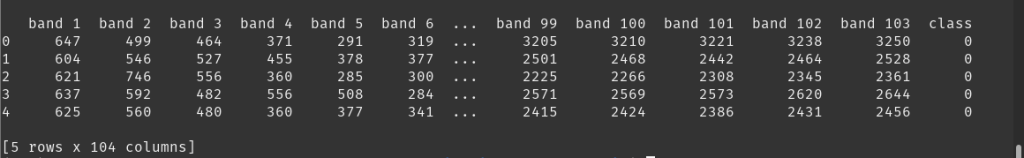
This data has many dimensions and if we wanted to plot it in its current form it could prove difficult.

I have not previously worked with this kind of data so I had to look things up. Fortunately I have found a blog post about working with hyperspectral data here. It had a great deal of information and code for someone that begins to learn about HSI but most of the content did not explain how the used methods work or why use them. I did some additional research on those and I will include the list of interesting sources at the end of this post….

Continue reading “Part 3 – Analysing Data, Preparation, Dimension Reduction and Visual Exploration”

Part 2 – Hyperspectral Cube – Getting familiar with data exploration.

Loading the data and check shape.

The Pavia University provided dataset includes the samples as well as the ground truth.

def load_data():
    '''
    X - input: 3D
    y - output: 2D
    '''
    X = loadmat('data/PaviaU.mat')['paviaU']
    y = loadmat('data/PaviaU_gt.mat')['paviaU_gt']
    print("X shape: ", X.shape)
    print("y shape: ", y.shape)
    return X, y

X, y = load_data()

To analyse HSI data I needed to remember that this image data has some differences from the regular cat, dog, human classification problem. HSI is high-dimensional and it took me a short while to wrap my head around this….

Continue reading “Part 2 – Hyperspectral Cube – Getting familiar with data exploration.”